Tuning HotSpot VM:process and methods
Many applications perform well with the default settings of a JVM, but some applications require additional JVM tuning to meet their performance requirement. A well-tuned JVM configurations used for one application may not be well suited for another application. As a result, understanding how to tune a JVM is a necessity.
Process of JVM Tuning
The following figure shows the process of JVM tuning.
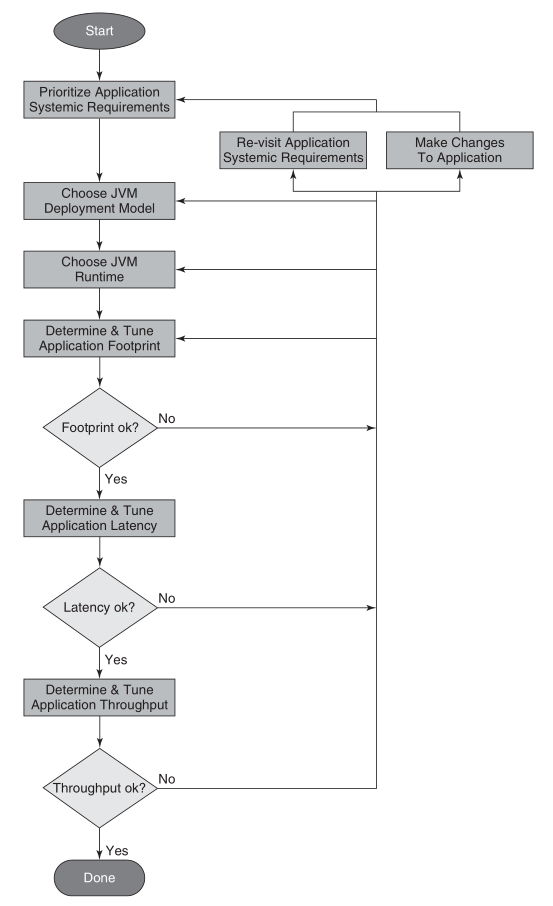
The first thing of JVM tuning is prioritize application systemic requirements. In contrast to functional requirements, which indicate functionally what an application computes or produces for output, systemic requirements indicate a particular aspect of an application’s such as its throughput, response time, the amount of memory it consumes, startup time, availability, manageability, and so on.
Performance tuning a JVM involves many trade-offs. When you emphasize one systemic requirement, you usually sacrifice something in another. For example, minimizing memory footprint usually comes at the expense of throughput and/or latency. As you improve manageability, you sacrifice some level of availability of the application since running fewer JVMs puts a larger portion of an application at risk should there be an unexpected failure. Therefore, when emphasizing systemic requirements, it is crucial to the tuning process to understand which are most important to the application.
Once you know which systemic requirements are most important, the following steps of tuning process are:
- Choose a JVM deployment mode.
- Choose a JVM runtime environment.
- Tuning the garbage collector to meet your application’s memory footprint, pause time/latency, and throughput requirements.
For some applications and their systemic requirements, it may take several iterations of this process until the application’s stakeholders are satisfied with the application’s performance.
Application Execution Assumptions
- An initialization phase where the application initializes important data structures and other necessary artifacts to begin its intended use.
- A steady state phase where the application spends most of its time and where the application’s core functionality is executed.
- An optional summary phase where an artifact such as a report may be generated, such as that produced by executing a benchmark program just prior to the application ending its execution.
The steady state phase where an application spends most of its time is the phase of most interest.
Testing Infrastructure Requirements
The performance testing environment should be close to the production environment. The better the testing environment replicates the production environment running with a realistic production load, the more accurate and better informed tuning decision will be.
Application Systemic Requirements
There are several application systemic requirements, such as its throughput, response time, the amount of memory it consumes, its availability, its manageability, and so on.
Availability
Availability is a measure of the application being in an operational and usable state. An availability requirement expresses to what extent an application, or portions of an application, are available for use when some component breaks or experiences a failure.
In the context of a Java application, higher availability can be accomplished by running portions of an application across multiple JVMs or by multiple instances of the application in multiple JVMs. One of the trade-offs when emphasizing availability is increased manageability costs.
Manageability
Manageability is a measure of the operational costs associated with running and monitoring the application along with how easy it is configure the application. A manageability requirement expresses the ease with which the system can be managed. Configuration tends to be easier with fewer JVMs, but the application’s availability may be sacrificed.
Throughput
Throughput is a measure of the amount of work that can be performed per unit time. A throughput requirement ignores latency or responsiveness. Usually, increased throughput comes at the expense of either an crease in latency and/or an increase in memory footprint.
Latency and Responsiveness
Latency, or responsiveness, is a measure of the elapsed time between when an application receives a stimulus to do some work and that work is completed. A latency or responsiveness requirement ignores throughput. Usually, increased responsiveness or lower latency, comes at the expense of lower throughput and/or an increase in memory footprint.
Memory Footprint
Memory footprint is a measure of the amount of memory required to run an application at a some level of throughput, some level of latency, and/or some level of availability and manageability. Memory footprint is usually expressed as either the amount of Java heap required to run the application and/or the total amount of memory required to run the application.
Startup Time
Startup time is a measure of the amount of time it takes for an application to initialize. The time it takes to initialize a Java application is dependent on many factors including but not limited to the number of classes loaded, the number of objects that require initialization, how those objects are initialized, and the choice of a HotSpot VM runtime, that is, client or server.
Rank Systemic Requirements
The first step in the tuning process is prioritizing the application’s systemic requirements. Doing so involves getting the major application stakeholders together and agreeing upon the prioritization.
Ranking the systemic requirements in order of importance to the application stakeholders is critical to the tuning process. The most important systemic requirements drive some of the initial decisions.
Choose JVM Deployment Model
There is not necessarily a best JVM deployment model. The most appropriate choice depends on which systemic requirements (manageability, availability, etc.) are most important.
Generally, with JVM deployment models has been the fewer the JVMs the better. With fewer JVMs, there are fewer JVMs to monitor and manage along with less total memory footprint.
Choose JVM Runtime
Choosing a JVM runtime for a Java application is about making a choice between a runtime environment that tends to be better suited for one or another of client and server applications.
There are several runtime environments to consider: client or server runtime, 32-bit or 64-bit JVM, and garbage collectors.
Client or Server Runtime
There are three types of JVM runtime to choose from when using the HotSpot VM: client, server, or tiered.
- The client runtime is specialized for rapid startup, small memory footprint, and a JIT compiler with rapid code generation.
- The server runtime offers more sophisticated code generation optimizations, which are more desirable in server applications. Many of the optimizations found in the server runtime’s JIT compiler require additional time to gather more information about the behavior of the program and to produce better performing generated code.
- The tiered runtime which combines the best of the client and server runtimes, that is, rapid startup time and high performing generated code.
If you do not know which runtime to initially choose, start with the server runtime. If startup time or memory footprint requirements cannot be met and you are using Java 6 Update 25 or later, try the tiered server runtime. If you are not running Java 6 Update 25 or later, or the tiered server runtime is unable to meet your startup time or memory footprint requirement, switch to the client runtime.
32-Bit or b4-Bit JVM
There is a choice between 32-bit and 64-bit JVMs.
The following table provides some guidelines for making an initial decision on whether to start with a 32-bit or 64-bit JVM. Note that client runtimes are not available in 64-bit HotSpot VMs.
| Operating System | Java Heap Size | 32-Bit or 64-Bit JVM |
|---|---|---|
| Windows | Less than 1300 megabytes | 32-bit |
| Windows | Between 1500 megabytes and 32 gigabytes | 64-bit with -d64 -XX:+UseCompressedOops command line options |
| Windows | More than 32 gigabytes | 64-bit with -d64 command line option |
| Linux | Less than 2 gigabytes | 32-bit |
| Linux | Between 2 and 32 gigabytes | 64-bit with -d64 -XX:+UseCompressedOops command line options |
| Linux | More than 32 gigabytes | 64-bit with -d64 command line option |
| Oracle Solaris | Less than 3 gigabytes | 32-bit |
| Oracle Solaris | Between 3 and 32 gigabytes | 64-bit with -d64 -XX:+UseCompressedOops command line options |
| Oracle Solaris | More than 32 gigabytes | 64-bit with -d64 command line option |
Garbage Collectors
There are several garbage collectors are available in the HotSpot VM: serial, throughput, mostly concurrent, and garbage first.
Since it is possible for applications to meet their pause time requirements with the throughput garbage collector, start with the throughput garbage collector and migrate to the concurrent garbage collector if necessary. If migration to the concurrent garbage collector is required, it will happen later in the tuning process as part of determine and tune application latency step.
The throughput garbage collector is specified by the HotSpot VM command line option -XX:+UseParallelOldGC or -XX:+UseParallelGC. The difference between the two is that the -XX:+UseParallelOldGC is both a multithreaded young generation garbage collector and a multithreaded old generation garbage collector. -XX:+UseParallelGC enables only a multithreaded young generation garbage collector.
GC Tuning Fundamentals
GC tuning fundamentals contain the following content: attributes of garbage collection performance, GC tuning principles, and GC logging. Understanding the important trade-offs among the attributes, the tuning principles, and what information to collect is crucial to JVM tuning.
The Performance Attributes
- Throughput.
- Latency.
- Footprint.
A performance improvement for one of these attributes almost always is at the expense of one or both of the other attributes.
The Principles
There are three fundamental principle to tuning GC:
- The minor GC reclamation principle. At each minor garbage collection, maximize the number of objects reclaimed. Adhering to this principle helps reduce the number and frequency of full garbage collections experienced by the application. Full GC typically have the longest duration and as a result are applications not meeting their latency or throughput requirements.
- The GC maximize memory principle. The more memory made available to garbage collector, that is, the larger the Java heap space, the better the garbage collector and application perform when it comes to throughput and latency.
- The 2 of 3 GC tuning principle. Tune the JVM’s garbage collector for two of the three performance attributes: throughput, latency, and footprint.
Keeping these three principles in mind makes the task of meeting your application’s performance requirements much easier.
Command Line Options and GC Logging
The JVM tuning decisions made utilize metrics observed from monitoring garbage collections. Collecting this information in garbage collection logs is the best approach. This garbage collection statistics gathering must be enabled via HotSpot VM command line options. Enabling GC logging, even in production systems, is a good idea. It has minimal overhead and provides a wealth of information that can be used to correlate application level events with garbage collection or JVM level events.
Several HotSpot VM command line options are of interest for garbage collection logging. The following is the minimal set of recommended command line options to use:
-XX:+PrintGCTimeStamps -XX:+PrintGCDetails -Xloggc:<filename> |
-XX:+PrintGCTimeStampsprints a time stamp representing the number of seconds since the HotSpot VM was launched until the garbage collection occurred.-XX:+PrintGCDetailsprovides garbage collector statistics.-Xloggc:<filename>directs the garbage collection information to the file.
Others useful options:
- To see a calendar date and time of day rather than a time stamp
-XX:+PrintGCDateStamps
- Tuning for low response time/latency
-XX:+PrintGCApplicationStoppedTime-XX:+PrintGCApplicationConcurrentTime-XX:+PrintSafepointStatistics
Here is example output using the preceding three garbage collection logging command line options.
45.152: [GC |
- In the first line of GC logging,
46.152is the number of seconds since the JVM launched. - In the second line,
PSYoungGenmeans a young generation garbage collection.295648K->32968K(306432K)means the occupancy of the young generation space prior and after to the garbage collection. The value inside the parentheses(306432K)is the size of the young generation space, that is, the total size of eden and the two survivor spaces. - In the third line,
296198K->33518K(1006848K)means the Java heap utilization before and after the garbage collection. The value inside the parentheses(1006848K)is the total size of the Java heap. - In the fourth line,
[Times: user=1.83 sys=0.01, real=0.11 secs]provides CPU and elapsed time information.1.83seconds of CPU time in user mode,0.01seconds of operating system CPU time,0.11seconds is the elapsed wall clock time in seconds of the garbage collection. In this example, it took 0.11 seconds to complete the garbage collection.
Determine Memory Footprint
Up to this point in the tuning process, no measurements have been taken. Only some initial choices have been made. This step of tuning process provides a good estimate of the amount of memory or Java heap size required to run the application. The outcome of this step identifies the live data size for the application. The live data size provides input into a good starting point for a Java heap size configuration to run the application.
Live data size is the amount of memory in the Java heap consumed by the set of long-lived objects required to run the application in its steady state. In other words, it is the Java heap occupancy after a full garbage collection while the application is in steady state.
Constraints
The following list helps determine how much physical memory can be made available to the JVM(s):
- Will the Java application be deployed in a single JVM on a machine where it is the only application running? If that is the case, then all the physical memory on the machine can be made available to JVM.
- Will the Java application be deployed in multiple JVMs on the same machine? or will the machine be shared by other processes or other Java application? If either case applies, then you must decide how much physical memory will be made available to each process and JVM.
In either of the preceding scenarios, some memory must be reserved for the operating system.
HotSpot VM Heap Layout
Before taking some footprint measurements, it is important to have an understanding of the HotSpot VM Java heap layout. The HotSpot VM has three major spaces: young generation, old generation, and permanent generation. The heap data area composes of the young generation and the old generation.
The new objects are allocated in the young generation space. Objects that survive after some number of minor garbage collections are promoted into the old generation space. The permanent generation space holds VM and Java class metadata as well as interned Strings and class static variables.
Following command line options specify the size of area data space:
- Heap area
-Xmxspecified the maximum size of heap.-Xmsspecified the initial size of heap.
- Young generation
-XX:NewSize=<n>[g|m|k]specified the initial and minimum size of the young generation space.-XX:MaxNewSize=<n>[g|m|k]specified the maximum size of the young generation space.-Xmn<n>[g|m|k]sets the initial, minimum, and maximum size of the young generation space.
- Permanent generation
-XX:PermSize=<n>[g|m|k]specified the initial and minimum size of permanent generation space.-XX:MaxPermSize=<n>[g|m|k]specified the maximum size of permanent space.
If any Java heap size, initial or maximum size, young generation size, or permanent generation size is not specified, the HotSpot VM automatically choose values based on the system configuration it discovers through an adaptive tuning feature called ergonomics.
It is important to understand that a garbage collection occurs when any one of the three spaces, young generation, old generation, or permanent generation, is in a state where it can no longer satisfy an allocation event.
When the young generation space does not have enough available to satisfy a Java object allocation, the HotSpot VM performs a minor GC to free up space. Minor GC tend to be short in duration relative to full GC.
When the old generation space no longer has available space for promoted objects, the HotSpot VM performs a full garbage collection. It actually performs a full garbage collection when it determines there is not enough available space for object promotions from next minor garbage collection.
A full garbage collection also occurs when the permanent generation space does not have enough available space to store additional VM or class metadata.
In a full GC, both old generation, permanent generation and young generation are garbage collected. -XX:-ScavengeBeforeFullGC will disable young generation space garbage collection on full garbage collections.
Heap Size Starting Point
To begin the heap size tuning process, a starting point is needed. The approach may start with a larger Java heap size than is necessary to run the Java application. The purpose of this step is to gather some initial data and further refine the heap size to more reasonable values.
For choose JVM runtime, start with the throughput garbage collector. The throughput garbage collector is specified with the -XX:+UseParallelOldGC command lien option.
If you have a good sense of amount of the Java heap space the Java application will required, you can use that Java heap size as a starting point. If you do not know what Java heap size the Java application will require, you can start with the Java heap size the HotSpot VM automatically chooses.
If you observe OutOfMemoryErrors in the garbage collection logs while attempting to put the application into its steady state, take notice of whether the old generation space ro the permanent generation space is running out of memory. The following example illustrates an OutOfMemoryError occurring as a result of a too small old generation space:
2010-11-25T18:51:03.895-0600: [Full GC |
The following example shows an OutOfMemoryError occurring as a result of a too small permanent generation space:
2010-11-25T18:26:37.755-0600: [Full GC |
If you observe an OutOfmemoryError in the garbage collection logs, try increasing the Java heap size to 80% to 90% of the physical memory you have available for the JVM.
Keep in mind the limitations of Java heap size based on the hardware platform and whether you are using a 32-bit or 64-bit JVM.
After increasing the Java heap size check the garbage collection logs for OutOfMemoryError. Repeat these steps, increasing the Java heap size at each iteration, until you observe no OutOfMemoryErrors in the garbage collection logs.
Once the application is running in its stead state without experiencing OutOfMemoryErrors, the next step is to calculate the application’s live data size.
Calculate Live Data Size
The live data size is the Java heap size consumed by the set of long-lived objects required to run the application in its steady state. In other words, the live data size is the Java heap occupancy of the old generation space and permanent space after a full garbage collection while the application is running in its steady state.
The live data size for a java application can be collected from the garage collection logs. The live data size provides the following tuning information
- An approximation of the amount of old generation Java heap occupancy consumed while running the application in steady state.
- An approximation of the amount of permanent generation heap occupancy consumed while running the application in steady state.
To get a good measure of an application’s live data size, it is best to look at the Java heap occupancy after several full garbage collections. Make sure these full garbage collections are occurring while the application is running in its steady state.
If the application is not experiencing full garbage collections, or they are not occurring very frequently, you can induce full garbage collections using the JVM monitoring tools VisualVM or JConsole. To force full garbage collections, monitor the application with VisualVM or JConsole and click the Perform GC button. A command line alternative to force a full garbage collection is use the HotSpot JDK distribution jmap command.
$ jmap -histo:live <process_id> |
The JVM process id can be acquired using the JDK’s jps command line.
Initial Heap Space Size Configuration
This section describes how to use live data size calculations to determine an initial Java heap size. It is wise to compute an average of the Java heap occupancy and garbage collection duration of several full garbage collections for your live data size calculation.
The general sizing rules shows below figure.
| Space | Command Line Option | Occupancy Factor |
|---|---|---|
| Java heap | -Xms and -Xmx | 3x to 4x old generation space occupancy after full GC |
| Permanent Generation or Metaspace | -XX:PermSize -XX:MaxPermSize |
1.2x to 1.5x permanent generation space occupancy after full GC |
| Young Generation or New | -Xmn | 1x to 1.5x old generation space occupancy after full garbage collection |
| Old Generation | Implied from overall Java heap size minus the young generation size | 2x to 3x old generation space occupancy after full garbage collection. |
Additional Considerations
It is important to know that the Java heap size calculated in the previous section does not represent the full memory footprint of a Java application. A better way to determine a Java application’s total memory use is by monitoring the application with an operating system tool such as prstat on Oracle Solaris, top on Linux, and Task Manager on Windows. The Java heap size may not be the largest contributor to an application’s memory footprint. For example, applications may require additional memory for thread stacks. The larger the number of threads, the more memory consumed in threads stacks. The deeper the method calls executed by the application, the larger the thread stacks. The memory footprint estimate for an application must include any additional memory use.
The Java heap sizes calculated in this step are a starting point. These sizes may be further modified in the remaining steps of the tuning process, depending on the application’s requirements.
Tune Latency/Responsiveness
This step begins by looking at the latency impact of the garbage collector starting with the initial Java heap size established in the last step “Determine memory footprint”.
The following activities are involved in evaluating the garbage collector’s impact on latency:
- Measuring minor garbage collection duration.
- Measuring minor garbage collection frequency.
- Measuring worst case full garbage collection duration.
- Measuring worst case full garbage collection frequency.
Measuring garbage collection duration and frequency is crucial to refining the Java heap size configuration. Minor garbage collection duration and frequency measurements drive the refinement of the young generation size. Measuring the worst case full garbage collection duration and frequency drive old generating sizing decisions and the decision of whether to switch from using the throughput garbage collector -XX:+UseParallelOldGC to using the concurrent garbage collector -XX:+UseConcMarkSweepGC.
Inputs
There are several inputs to this step of the tuning process. They are derived from the systemic requirements for the application.
- The acceptable average pause time target for the application.
- The frequency of minor garbage collection included latencies that are considered acceptable.
- The maximum pause time incurred by the application that can be tolerated by the application’s stakeholders.
- The frequency of the maximum pause time that is considered acceptable by the application’s stakeholders.
Tune Application Throughput
This is the final step of the turning process. The main input into this step is the application’s throughput performance requirements. An application’s throughput is something measured at the application level, not at the JVM level. Thus, the application must report some kind of throughput metric, or some kind of throughput metric must be derived from the operations it is performing. When the observed application throughput meets or exceeds the throughput requirements, you are finished with the tuning process. If you need additional application throughput to meet the throughput requirements, then you have some additional JVM tuning work to do.
Another important input into this step is the amount of memory that can be made available to the deployed Java application. As the GC maximize Memory Principle says, the more memory that can be made available for the Java heap, the better the performance.
It is possible that the application’s throughput requirements cannot be met. In that case, the application’s throughput requirements must be revisited.
Summary
There are some important summaries are shown below:
- You should follow the process of JVM tuning.
- Your requirements determine what to tuning. There are many trade-offs, you must determine what are most important requirements.
- The main requirements for JVM tuning are memory footprint, latency, and throughput.
References
[1] Java Performance by Charlie Hunt